Bitteliten
Skal man litt ut fra land så er denne bra
https://www.yr.no/hav_og_kyst/kart_over_fiskebankene/
vedr tordenvær. I Weather4D og GFS er det en CAPE funksjon som sier noe om sannsynligheten for lyn.
How to use CAPE
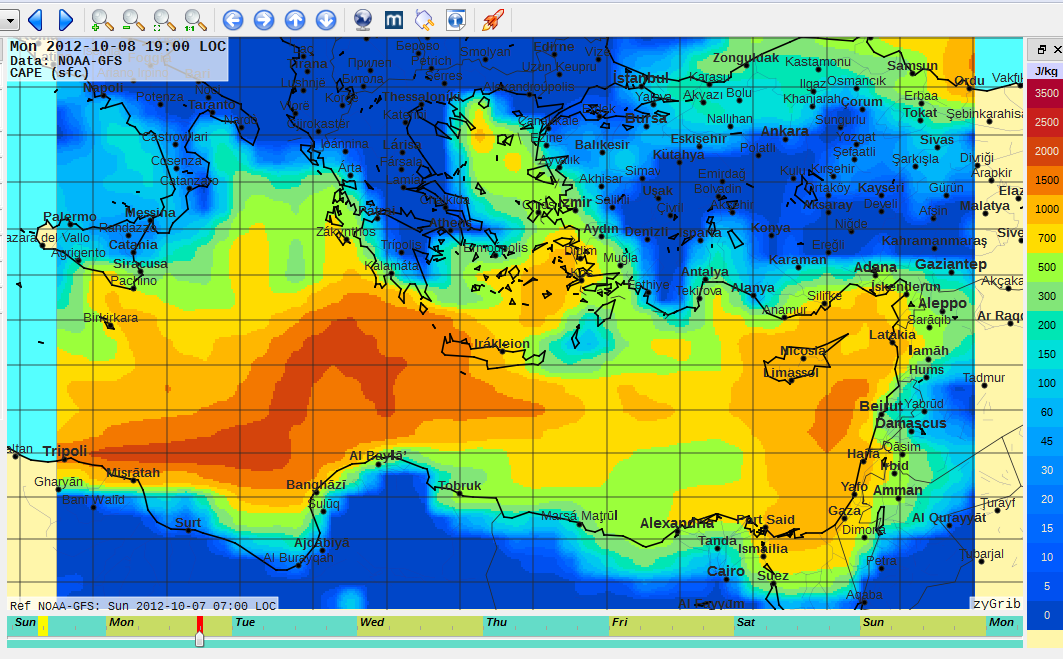
That is a start and could be the basis of a rough and ready rule of thumb. We can do a little better by assessing the risk objectively using CAPE. The name will be known to those who use zyGrib to get NOAA GFS GRIB data as it will be to users of the WeatherTrack and Weather4D iPad GRIB Apps. Convective Available Potential Energy is a measure of the energy that can be realized if there is enough heating to give convection. The values are given in Joules per Kilogram of air but the pictorial representations are good enough for our purposes. The greater the energy that is released during convection, the greater will be the charge separation and the more lightning is liable to occur.
NOTE
zyGrib is no longer supported although it will continue to function. An improved service is XyGrib, a fork of zyGrib. XyGrib will be updated from time yo time. It will be expanded to be able to decode other GRIB formats.
When the CAPE index is zero, the air will be stable and convection is not possible. For CAPE values up to about 1000, the probability of heavy showers increases. The table gives a rough guide of the likelihood of lightning when using CAPE charts.
|
CAPE Index |
Lightning Risk |
|
< 1000 |
Slight |
|
1000 – 2500 |
Moderate |
|
Very |
|
|
> 3500 |
Extremely |
The example shows a prediction of CAPE for the Mediterranean at 1800 on Monday 8 October, 2012. There would be zero probability in the areas shown in blue areas; a slight probability in the yellow areas but increasing likelihood of lightning as the colours deepen to red.
A zyGrib prediction of CAPE. The prudent sailor would try to avoid the area east of Tripoli, near the coast of North Africa. Synoptic charts showed a rather weak looking trough of low pressure.


